Observability tier
Docker Compose stack: Prometheus, Grafana, Loki, Tempo, Alertmanager, object storage. Promtail on workloads ships logs; node metrics scraped for dashboards and AI context.
Infrastructure as code, configuration management, and containerised observability — deployed into your VPC so architects can audit every hop.
AI augments the stack; it does not replace your telemetry systems of record.
Logical tiers — sized and scaled per engagement. Workload hosts can be existing servers or new EC2 instances.
Docker Compose stack: Prometheus, Grafana, Loki, Tempo, Alertmanager, object storage. Promtail on workloads ships logs; node metrics scraped for dashboards and AI context.
Ollama (GPU or CPU profile), FastAPI MCP server proxying Prom/Loki/Alertmanager APIs, Streamlit multipage UI, optional metrics exporters for model and GPU observability.
Application and database hosts — log agents, optional OpenTelemetry collector forwarding traces to Tempo. Linux config collector for History door snapshots.
Terraform for EC2, networking, DNS, security groups. Ansible for Docker, Compose stacks, host baseline, scrape targets, and config collection playbooks.
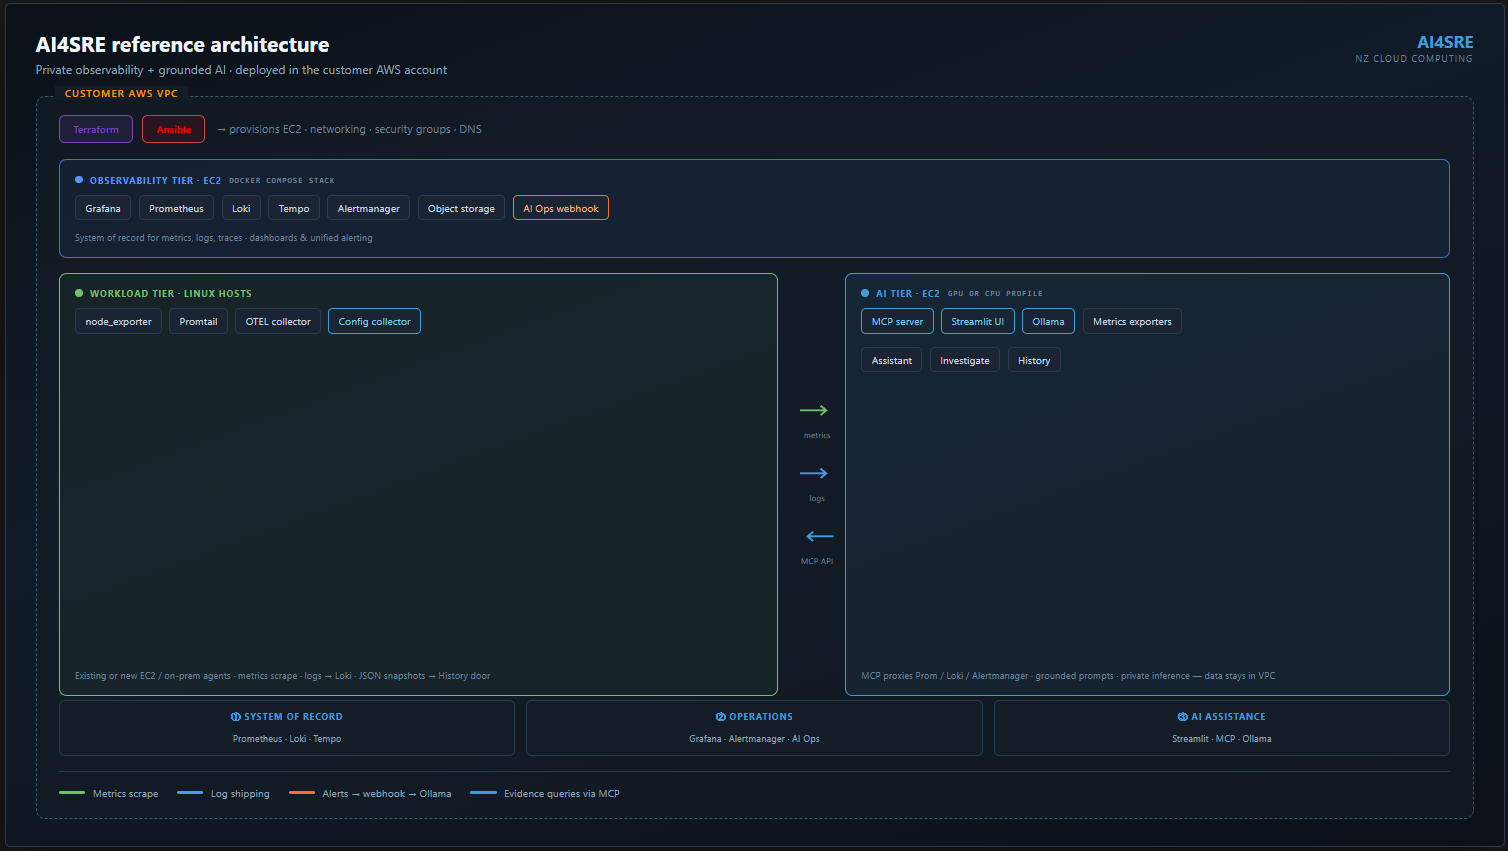
Streamlit and the AI Ops webhook do not scrape observability APIs directly from arbitrary endpoints. A small MCP service exposes health-checked proxies for Prometheus instant and range queries, Loki log range, and Alertmanager alerts — keeping URLs, timeouts, and credentials centralised.
Ansible invokes a JSON collector on Linux hosts. A ingest step normalises snapshots, computes diffs between dates, and stores rows in SQLite. Streamlit queries that store — no LLM hallucination on “what changed” when the row exists.
The reference implementation is deliberately honest about POC scope: tighten TLS, authentication for Grafana/MCP/Streamlit, secret management, HA, and model operations before internet-facing or multi-tenant use. We help teams map that gap as part of implementation and advisory engagements.